Inspiration
Today marks the final week of the 2021 – 2022 NFL regular season, the first in which teams played 17 games. Traditionally, intra-divisional games are played amongst teams during the last week as playoff seedings are finalized. As I was watching the Green Bay Packers drop their last regular season game against the Detroit Lions, the number one seed already locked up the week prior, I kept my eyes on other important intra-divisional games around the league. And what an evening it was, with a game that came right down to the final kick in overtime between the Las Vegas Raiders and the Los Angeles Chargers!
Watching all of these intradivisional games, a question arose in my mind: which division has had the most success versus other divisions? After all, the NFL realigned its divisions in the 2002 – 2003 NFL season, so there have been a full twenty regular seasons of NFL play with the current format of 32 teams grouped into eight divisions. So, after twenty years of play, which division has fared the best?
NFL Regular Season Schedule
The first question that I will address is that of scheduling – how are the regular season of NFL teams determined?
The NFL incorporates a rigid scheduling algorithm for regular season games. Here is the formula for a 16-game regular season:
– Six games are played against the team’s three other divisional rivals
– Four intraconference games are played against each of four teams in another division
– Four interconference games are played against each of four teams in another division
– One intraconference game is played against a team of the remaining two divisions of the conference
– One interconference game is played against a team of the remaining two divisions of the conference
For the 2021 – 2022 NFL season, a 17th regular season game was added (another intraconference game against a team of the remaining two divisions of the conference).
Thus, a team is guaranteed to play its divisional rivals twice per year, an intraconference foe at least once every three years, and an interconference foe at least once every four years. As there have been twenty NFL regular seasons played in the current divisional format, the cycle of interconference divisional matchup have occurred five teams – plenty of data with which to play around.
Data Extraction Process
Similar to my other football-related analyses on Perfect Weeks, All-time NFL Win Percentage, and the greatest NFL regular seasons, I used a simple Web Scraper add-on in Chrome on the Pro Football Reference website.
I only needed the twenty regular seasons from the 2002 – 2003 NFL season to the 2021 – 2022 NFL season, but I ran the scraper on the entire NFL database from 1920 to present, in case I wanted to revisit the data in the future for additional historic analysis. Since the division realignment in 2002, each NFL team played a total of 321 NFL regular season games, and the NFL as a whole played 5136 regular season games. Of these 5136 regular season games, 1920 were intra-divisional games and 3216 were extradivisional games.
Team Season-by-Season Records
Over the past twenty years, most teams have gone through periods of success and failure though the distribution of each is varied among the teams. Some divisions, such as the American Football Conference (AFC) East have seen one team dominate throughout the past twenty years, while other divisions such as the National Football Conference (NFC) South have seen each team achieve years of success.
Overall Divisional Record
The most simple means of measuring division strength is the basic overall record in the regular season, which we can break down season by season and over the entirety of the past two decades.
As expected, over the course of two decades, teams’ relative strengths wax and wane, and by averaging the four teams in each division, the overall divisional record hovers around 0.500. Moreover, given that there are 12 intradivisional games played per division each season, the theoretical ceiling and floor for the divisional record is 0.813 and 0.188 for a 16-game regular season.
Obviously, we have never had a division in which all teams went 13 – 3 (or 3 – 13 for that matter). That doesn’t mean that there haven’t been seasons during which three or four of the teams in one division have really performed well. The two best regular seasons were completed by the 2007 AFC South and the 2013 NFC West, the teams of which won at a rate of 0.656, the equivalent of winning 10.5 out of 16 games. As six games are within the division, this means that each team won an average of 7.5 out of 10 games against interdivisional foes – an incredible win percentage of 0.750.
If we look briefly into how this translates into post-season success, the 2013 Seattle Seahawks did win the Super Bowl by dismantling the Denver Broncos. However, the 2007 Indianapolis Colts lost to the San Diego Chargers in the AFC Divisional Round.
Division vs. Division
When I first came up with the idea of this post, my immediate focus was each division’s record versus the other seven divisions in the NFL. As divisions face each other on a rotating basis, every three years for intraconference teams and every four years for interconference teams, it didn’t really make sense in my mind to incorporate a head-to-head record on a yearly basis.
If we take the chart of the NFC North as an example – there are too many cells in which there are no games played between divisions or only a few games played.
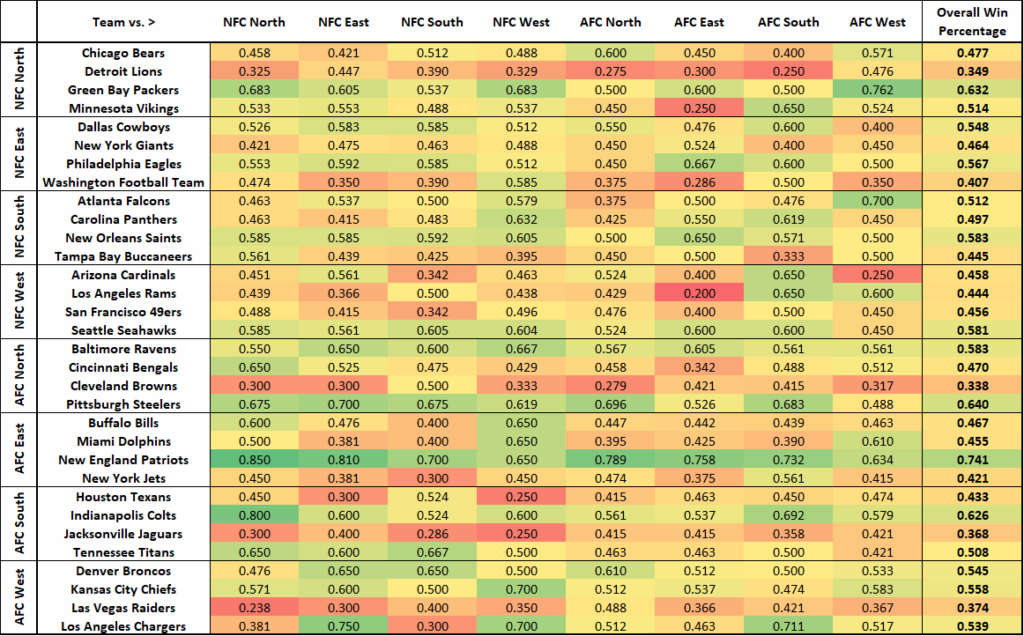
Therefore, I decided to compile the cumulative win – loss – tie record as well as win percentage for these interdivisional bouts.
Records between divisions ranged from 0.400 to 0.600 (the AFC East clobbers on both the NFC North and the NFC West, while the NFC West clobbers on the AFC South). Assigning win – loss – tie records by division on the basis of win percentage in these divisional games, not counting games within the division:
NFC North: 3 – 4 – 0
NFC East: 3 – 4 – 0
NFC South: 4 – 2 – 1
NFC West: 1 – 6 – 0
AFC North: 5 – 2 – 0
AFC East: 6 – 1 – 0
AFC South: 1 – 5 – 1
AFC West: 4 – 3 – 0
NFC Conference vs. AFC Conference
Over the past twenty years, teams in the AFC have won a total of 666 regular season games head-to-head against teams in the NFC, with 624 loses. Accordingly, since the 2002 NFL season, AFC teams have won 11 Super Bowls compared with 8 Super Bowls won by NFC Teams, though the sensitivity is quite poor.
There are several regular seasons of note in which one conference absolutely demolished the other head-to-head, including the 2004 season (AFC won 44 / 64 games), 2006 season (AFC won 40 / 64 games), and the 2017 season (NFC won 41 / 64 games). The current NFL regular season closed with a very equal interconference record of 40 – 39 – 1 in favor of NFC teams.
Team vs. Division
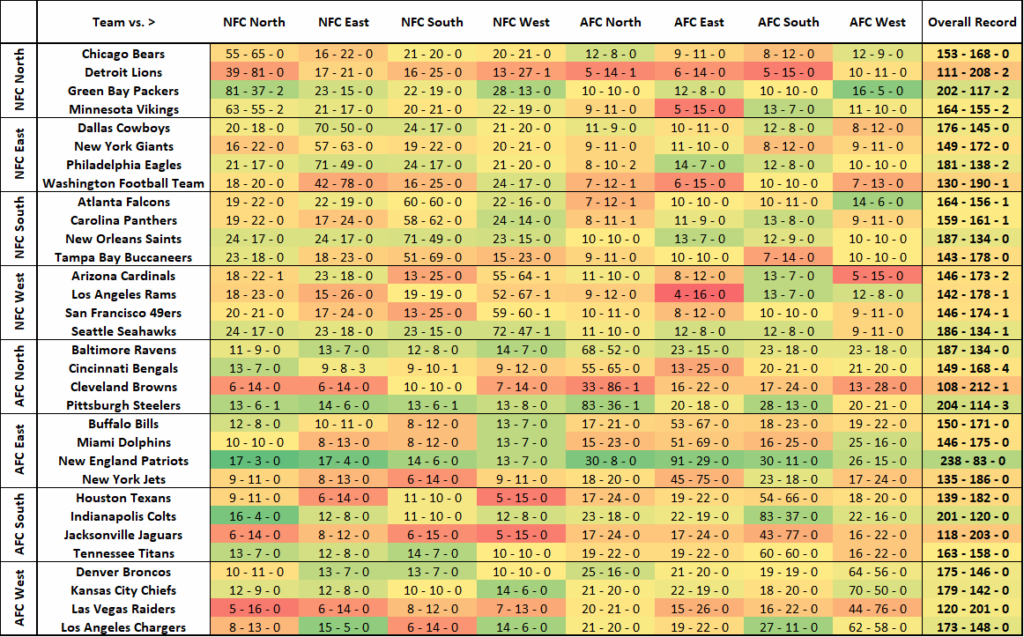
Before wrapping this up, I wanted to look into how each team has fared against other divisions. The usual suspects once again rise to the top or fall to the bottom – looking at you two, New England Patriots and Cincinnati Bengals…
If we were to then assign “win – loss – tie” records to each team based on how they fared against the eight divisions, we can then obtain each team’s “Record against divisions.”
Three teams, the Baltimore Ravens, the Indianapolis Colts, and New England Patriots have accumulated a perfect 8 – 0 record against the NFL divisions.
The Green Bay Packers and the New Orleans Saints have undefeated 6 – 0 – 2 records. The Cleveland Browns and San Francisco 49ers have unenviable 0 – 7 – 1 records while the Jacksonville Jaguars and the Las Vegas Raiders have 0 – 8 “perfect” records.
Reflection
As everyone might have expected, the AFC East has had the most regular season success since the expansion to 32 NFL teams. Although regular season success is not a guarantee or postseason glory, this division has claimed 5 of the 19 Super Bowls since 2002, albeit all from the same team. The NFC North and the AFC South have only had one Super Bowl title each since 2002 – perhaps this is the year for another?


