
Inspiration
I covered this comprehensively in the introduction section of the text itself, so I won’t belabor the point here. All I will say is that it relates to the image above. I took out a couple of paragraphs on the website to streamline the text, so click on the PDF button if you want to check out the full introduction and my obsession with cheese; otherwise, feel free to dive in below into the “analysis.”
“If it doesn’t matter who wins or loses, then why do they keep score?”
Vince Lombardi
I love cheese. Cheese is life. As a child, I remember going to the local grocery store with my mother, with one or two goals in mind: 1. To go to the dairy aisle to get a block of cheese; 2a. To go to the chips and snacks aisle to snag a bag of beef jerky; 2b. To go to said chips and snacks aisle to pick up a combination beef stick and cheese stick packaged in one. People really aren’t kidding when they say Wisconsin is the Dairy State, and there were varieties plentiful on display. But, seven-or-eight-year-old me did not know any better, and more often than not, I would convince my mother to come home with one of those Kraft’s Singles —and no, Robert, I’m not talking about the ones you find at spas… I’m sure you’ve had these before: the floppy, plasticky, yellow squares wrapped individually in plastic, all contained within a plastic packaging. Kraft’s Singles were my go-to, my manna from Piggly Wiggly.
Fast forward a dozen-plus years, and I find myself watching the NFC Championship Game. Green Bay versus Tampa Bay. Lambeau Field. Oh baby. My hand puts down the beer and brings up a chip laden with black bean and cotija cheese tastiness towards my mouth. Heart rate tachycardic; blood pressure hypertensive. Nothing like a Packers’ playoff game to ramp up the blood pressure.
If you are reading this, then you already know the results of the game. Some good, a lot bad, and even more ugly. Another year, another crushing Packers playoff loss. Another disappointing end to an otherwise sparkling regular season.
In the time that I’ve watched the Packers, from the early 2000s and onwards, I have been quite fortunate to have seen some excellent teams in action: Favre’s last hurrah of 2007, the loaded secondary of 2010 (goodness me, I miss Woodson and Collins), the offensive juggernaut of 2011, and the number one seeded team of 2020. Perhaps throw in the 2016 and 2019 Packers that clawed their way to reach the NFC Championship Game. Was there even a 2014 postseason?
After having several days to marinate this latest loss, I came to wonder – what has been the best Packers’ regular season? For the Packers, if I had to guess, I would put my money on the 1996 Packers squad led by the Gunslinger and the Minister of Defense, or perhaps one of the teams from the golden Lombardi years. But how about for the league as a whole?
The excellent statistical site 538.com already provides Elo-based ratings for all NFL teams, and I encourage you to check that out if you haven’t already. A big plus of 538 is that their ratings also include the postseason. However, I didn’t want to just go to their website and get the answer with the click of a few buttons. So, instead, I opted to use pro-football-reference.com. Specifically, I looked at the expected win-loss for each team’s season using the so-called Pythagorean Theorem, a formula that calculated a team’s expected win-loss based off points for and points against. No trigonometry necessary! With only two variables, it is a very simple formula, so I am not going to overanalyze the statistical backing of it, but I think it would be a fun to carry out the following analyses (regular season only): 1. Top-ten Green Bay Packers Seasons; 2. Top Regular Season for each NFL team; 3. Top Ten Overall Regular Seasons.
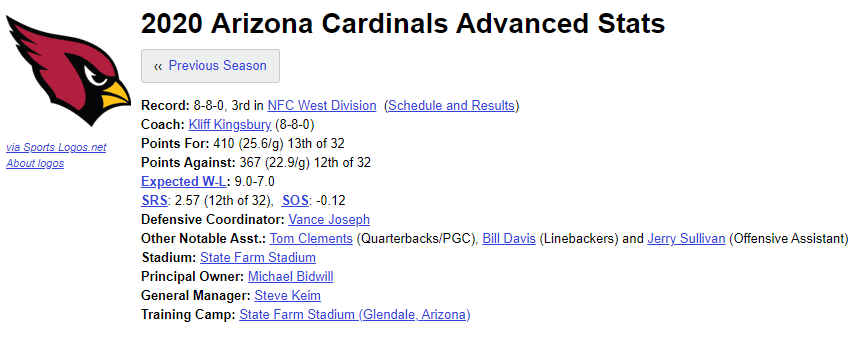
Pro Football Reference presents their metric as “Expected W-L: X.X – Y.Y,” where X.X is the expected number of wins and Y.Y is the expected number of losses, both to the tenth (as seen in the image below, when the 2020 Arizona Cardinals had an Expected W-L of 9.0 – 7.0).
I did not want to have to go through every team’s season link by link, so I opted instead to use a web scraper to extract out the information. I had no idea how to do that, but it was actually quite simple with the aid of Google Chrome’s Web Scraper Add-on and a random YouTube tutorial. At the prescribed 2000 ms per page, the entirety of the scraping took about 95 minutes. I extracted the data as comma-separated values to Excel. I did not try to learn how to extract separately the “X.X” and “Y.Y” portions of the line. Instead, I scraped the entire “Expected W-L: X.X – Y.Y” text so I spent a bit of time and elbow grease to clean up the file after – fun fact, there were a total of 2,062 seasons across 32 NFL teams. In hindsight, I suppose the more accurate method would have been to extract out “Points For” and “Points Against” to calculate the win-loss myself, but the protocol I used did the trick in the end.
§
After pulling the results, it became apparent that some very early NFL seasons had extremely high Pythagorean win-loss percentages, including a ridiculous 0.992 for the 1920 Decatur Staleys (Chicago Bears) and 1929 Green Bay Packers, as seen in the Pythagorean Win Percentage Table for ants, below. Therefore, I decided to simply draw a line, literally, and not include pre-Super Bowl seasons from contention. I think perhaps the theorem does not work as neatly in the earlier seasons due to a wide point spread of games secondary to a lack of parity. Take a guess at how many points were allowed by the Staleys and Packers in those seasons. Answer: 21 (1.6 points per game) and 22 (1.7 points per game), respectively. Yeah, that is not happening in today’s league. Nevertheless, I find it neat to see the all-time expected win percentage heatmap of the 32 current NFL franchises. For example, from a bird’s eye view, one can witness the green dynasties of the 1940s AAFC Cleveland Browns, the 1970s Oakland Raiders, Los Angeles Rams, Miami Dolphins, Pittsburgh Steelers, and Minnesota Vikings (though no Super Bowls for this latter team), as well as the stretches of dominance by the 1980s San Francisco 49ers and 2000s-2010s New England Patriots. Also, as the “-“dash indicates years when that respective franchise did not play, we can spot the three year gap in the 1980s when Modell up-and-moved the Cleveland Browns to Baltimore, as well as two other quirks: due to lack of players because of World War II, the 1943 Cleveland Rams suspended their season while the 1943 Pittsburgh Steelers joined forces with the Philadelphia Eagles to form the fabled “Steagles;” the following year, the Steelers combined with the Chicago Cardinals to create the “Card-Pitt” team. Extra fun factoid – due to their 0-10 finish in that season, the 1944 merged team was labelled by sportswriters as the “Car-Pitts” (carpets).

Now on to the analysis. Before we begin, let me again present the three scenarios I wanted to consider. Note that this data only refers to regular season outcomes. Also, I’m going to make the prediction that all of the following teams will be on the top-ten overall list: 1972 Dolphins, 1984 49ers, 1985 Bears, 1991 team from D.C., and 2007 Patriots. I know the 2007 Patriots hold the record for regular season point differential at +315, but I think a relatively higher “Points Against” will hold them back. We’ll see how far I am from the mark.
1. Top-ten Green Bay Packers Regular Seasons (Super Bowl Era)
2. Top Regular Season for each NFL Team (Super Bowl Era)
3. Top-Ten Overall Regular Seasons (Super Bowl Era)
§
1. Top-Ten Green Bay Packers seasons (Super Bowl Era)
I definitely did Vince Lombardi dirty – starting this document with one of his quotes about winning, and then disregarding postseason play! Feels like a reverse Jim Mora in a way. Also, by foregoing pre-Super Bowl seasons, I did eliminate three Lombardi-coached NFL Championships of the 1961, 1962, and 1965 squads, as well as all those championship Lambeau teams.
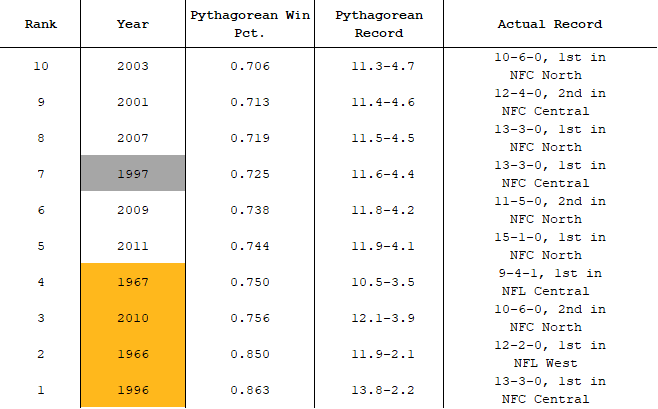
Here’s a summary table, before we delve into individual seasons. I’m sure you already know what the gold color indicates. Perhaps I should have included the early 1960s Packers, though they were too dominant – six of the ten slots would have been taken up!
Terms:
PF = Points For
PA = Points Against
10. 2003 Green Bay Packers
Regular Season Record: 10-6
Pythagorean Record: 11.3-4.7
PF: 442 (27.6/g) 4th of 32
PA: 307 (19.2/g) 11th of 32
Playoffs: Won Wild Card 33-27 (Seahawks)
Lost Div. 17-20 (Eagles)
9. 2001 Green Bay Packers
Regular Season Record: 12-4
Pythagorean Record: 11.4-4.6
PF: 390 (24.4/g) 5th of 31
PA: 266 (16.6/g) 5th of 31
Playoffs: Won Wild Card 25-15 (49ers)
Lost Div. 17-45 (Rams)
8. 2007 Green Bay Packers
Regular Season Record: 13-3
Pythagorean Record: 11.5-4.5
PF: 435 (27.2/g) 4th of 32
PA: 291 (18.2/g) 6th of 32
Playoffs: Won Divisional 42-20 (Seahawks)
Lost NFC Conf. Champ. 20-23 (Giants)
7. 1997 Green Bay Packers
Regular Season Record: 13-3
Pythagorean Record: 11.6-4.4
PF: 422 (26.4/g) 2nd of 30
PA: 282 (17.6/g) 5th of 30
Playoffs: Won Divisional 21-7 (Buccaneers)
Won NFC Conf. Champ. 23-10 (49ers)
Lost Super Bowl XXXII 24-31 (Broncos)
6. 2009 Green Bay Packers
Regular Season Record: 11-5
Pythagorean Record: 11.8-4.2
PF: 461 (28.8/g) 3rd of 32
PA: 297 (18.6/g) 7th of 32
Playoffs: Lost Wild Card 45-51 (Cardinals)
5. 2011 Green Bay Packers
Regular Season Record: 15-1
Pythagorean Record: 11.9-4.1
PF: 560 (35.0/g) 1st of 32
PA: 359 (22.4/g) 19th of 32
Playoffs: Lost Divisional 20-37 (Giants)
4. 1967 Green Bay Packers
Regular Season Record: 9-4-1
Pythagorean Record: 10.5-3.5
PF: 332 (23.7/g) 9th of 16
PA: 209 (14.9/g) 3rd of 16
Playoffs: Won Divisional 28-7 (Rams)
Won NFL Championship 21-17 (Cowboys)
Won Super Bowl II 33-14 (Raiders)
3. 2010 Green Bay Packers
Regular Season Record: 10-6
Pythagorean Record: 12.1-3.9
PF: 388 (24.3/g) 10th of 32
PA: 240 (15.0/g) 2nd of 32
Playoffs: Won Wild Card 21-16 (Eagles)
Won Divisional 48-21 (Falcons)
Won NFC Conf. Championship 21-4 (Bears)
Won Super Bowl XLV 31-25 (Steelers)
2. 1966 Green Bay Packers
Regular Season Record: 12-2
Pythagorean Record: 11.9-2.1
PF: 335 (23.9/g) 4th of 15
PA: 163 (11.6/g) 1st of 15
Playoffs: Won NFL Championship 34-27 (Cowboys)
Won Super Bowl I 35-10 (Chiefs)
1. 1996 Green Bay Packers
Regular Season Record: 13-3
Pythagorean Record: 13.8-2.2
PF: 456 (28.5/g) 1st of 30
PA: 210 (13.1/g) 1st of 30
Playoffs: Won Divisional 35-14 (49ers)
Won NFC Conf. Championship 30-13 (Panthers)
Won Super Bowl XXXI 35-21 (Patriots)
2. Top Regular Seasons for each NFL Team (Super Bowl Era)
NFL teams organized by current NFL division alignment, as of 2020-2021 NFL season
AFC East
1990 Buffalo Bills
Regular Season Record: 13-3
Pythagorean Record: 12.2-3.8
PF: 428 (26.8/g) 1st of 28
PA: 263 (16.4/g) 6th of 28
Playoffs: Won Divisional 44-34 (Dolphins)
Won AFC Conf. Championship 51-3 (Raiders)
Lost Super Bowl XXV 19-20 (Giants)
1973 Miami Dolphins
Regular Season Record: 12-2
Pythagorean Record: 12.3-1.7
PF: 343 (24.5/g) 5th of 26
PA: 150 (10.7/g) 1st of 26
Playoffs: Won Divisional 34-16 (Bengals)
Won AFC Conf. Championship 27-10 (Raiders)
Won Super Bowl VIII 24-7 (Vikings)
2007 New England Patriots
Regular Season Record: 16-0
Pythagorean Record: 13.8-2.2
PF: 589 (36.8/g) 1st of 32
PA: 274 (17.1/g) 4th of 32
Playoffs: Won Divisional 31-20 (Jaguars)
Won AFC Conf. Championship 21-12 (Chargers)
Lost Super Bowl XLII 14-17 (Giants)
1998 New York Jets
Regular Season Record: 12-4
Pythagorean Record: 11.9-4.1
PF: 416 (26.0/g) 5th of 30
PA: 266 (16.6/g) 2nd of 30
Playoffs: Won Divisional 34-24 (Jaguars)
Lost AFC Conf. Championship 10-23 (Broncos)
AFC North
2000 Baltimore Ravens
Regular Season Record: 12-4
Pythagorean Record: 13.5-2.5
PF: 333 (20.8/g) 14th of 31
PA: 165 (10.3/g) 1st of 31
Playoffs: Won Wild Card 21-3 (Broncos)
Won Division 24-10 (Titans)
Won AFC Conf. Championship 16-3 (Raiders)
Won Super Bowl XXXV 34-7 (Giants)
1975 Cincinnati Bengals
Regular Season Record: 10-4
Pythagorean Record: 10.5-3.5
PF: 335 (23.9/g) 6th of 28
PA: 210 (15.0/g) 7th of 28
Playoffs: Did not qualify
1994 Cleveland Browns
Regular Season Record: 11-5
Pythagorean Record: 12.3-3.7
PF: 340 (21.3/g) 11th of 28
PA: 204 (12.8/g) 1st of 28
Playoffs: Won Wild Card 20-13 (Patriots)
Lost Divisional 9-29 (Steelers)
1976 Pittsburgh Steelers
Regular Season Record: 10-4
Pythagorean Record: 12.5-1.5
PF: 342 (24.4/g) 5th of 28
PA: 138 (9.9/g) 1st of 28
Playoffs: Won Divisional 40-14 (Colts)
Lost AFC Conf. Championship 7-24 (Raiders)
AFC South
1968 Baltimore Colts (Indianapolis Colts)
Regular Season Record: 13-1
Pythagorean Record: 12.9-1.1
PF: 402 (28.7/g) 2nd of 16
PA: 144 (10.3/g) 1st of 16
Playoffs: Won Divisional 24-14 (Vikings)
Won NFL Championship 34-0 (Browns)
Lost Super Bowl III 7-16 (Jets)
2011 Houston Texans
Regular Season Record: 10-6
Pythagorean Record: 10.9-5.1
PF: 381 (23.8/g) 10th of 32
PA: 278 (17.4/g) 4th of 32
Playoffs: Won Wild Card 31-10 (Bengals)
Lost Divisional 13-20 (Ravens)
1999 Jacksonville Jaguars
Regular Season Record: 14-2
Pythagorean Record: 12.9-3.1
PF: 396 (24.8/g) 6th of 31
PA: 217 (13.6/g) 1st of 31
Playoffs: Won Divisional 62-7 (Dolphins)
Lost AFC Conf. Championship 14-33 (Titans)
2000 Tennessee Titans
Regular Season Record: 13-3
Pythagorean Record: 12.9-3.1
PF: 346 (21.6/g) 13th of 31
PA: 191 (11.9/g) 2nd of 31
Playoffs: Lost Divisional 10-24 (Ravens)
AFC West
1977 Denver Broncos
Regular Season Record: 12-2
Pythagorean Record: 11.4-2.6
PF: 274 (19.6/g) 10th of 28
PA: 148 (10.6/g) 3rd of 28
Playoffs: Won Divisional 34-21 (Steelers)
Won AFC Conf. Championship 20-17 (Raiders)
Lost Super Bowl XII 10-27 (Cowboys)
1968 Kansas City Chiefs
Regular Season Record: 12-2
Pythagorean Record: 12.1-1.9
PF: 371 (26.5/g) 4th of 10
PA: 170 (12.1/g) 1st of 10
Playoffs: Lost Divisional 6-41 (Raiders)
1967 Oakland Raiders (Las Vegas Raiders)
Regular Season Record: 13-1
Pythagorean Record: 11.7-2.3
PF: 468 (33.4/g) 1st of 9
PA: 233 (16.6/g) 2nd of 9
Playoffs: Won AFL Championship 40-7 (Oilers)
Lost Super Bowl II 14-33 (Packers)
1979 San Diego Chargers (Los Angeles Chargers)
Regular Season Record: 12-4
Pythagorean Record: 12.3-3.7
PF: 411 (25.7/g) 2nd of 28
PA: 246 (15.4/g) 2nd of 28
Playoffs: Lost Divisional 14-17 (Oilers)
NFC East
1968 Dallas Cowboys
Regular Season Record: 12-2
Pythagorean Record: 12.3-1.7
PF: 431 (30.8/g) 1st of 16
PA: 186 (13.3/g) 2nd of 16
Playoffs: Lost Divisional 20-31 (Browns)
1990 New York Giants
Regular Season Record: 13-3
Pythagorean Record: 12.0-4.0
PF: 335 (20.9/g) 15th of 28
PA: 211 (13.2/g) 1st of 28
Playoffs: Won Divisional 31-3 (Bears)
Won NFC Conf. Championship 15-13 (49ers)
Win Super Bowl XXV (Bills)
1980 Philadelphia Eagles
Regular Season Record: 12-4
Pythagorean Record: 12.6-3.4
PF: 384 (24.0/g) 6th of 28
PA: 222 (13.9/g) 1st of 28
Playoffs: Won Divisional 31-16 (Vikings)
Won NFC Conf. Championship 20-7 (Cowboys)
Lost Super Bowl XV 10-27 (Raiders)
1991 Washington Redskins (Washington Football Team)
Regular Season Record: 14-2
Pythagorean Record: 13.8-2.2
PF: 485 (30.3/g) 1st of 28
PA: 224 (14.0/g) 2nd of 28
Playoffs: Won Divisional 24-7 (Falcons)
Won NFC Conf. Championship 41-10 (Lions)
Won Super Bowl XXVI 37-24 (Bills)
NFC North
1985 Chicago Bears
Regular Season Record: 15-1
Pythagorean Record: 14.1-1.9
PF: 456 (28.5/g) 2nd of 28
PA: 198 (12.4/g) 1st of 28
Playoffs: Won Divisional 21-0 (Giants)
Won NFC Conf. Championship 24-0 (Rams)
Won Super Bowl XX 46-10 (Patriots)
1970 Detroit Lions
Regular Season Record: 10-4
Pythagorean Record: 11.0-3.0
PF: 347 (24.8/g) 2nd of 26
PA: 202 (14.4/g) 2nd of 26
Playoffs: Lost Divisional 0-5 (Cowboys)
1996 Green Bay Packers
Regular Season Record: 13-3
Pythagorean Record: 13.8-2.2
PF: 456 (28.5/g) 1st of 30
PA: 210 (13.1/g) 1st of 30
Playoffs: Won Divisional 35-14 (49ers)
Won NFC Conf. Championship 30-13 (Panthers)
Won Super Bowl XXXI (Patriots)
1969 Minnesota Vikings
Regular Season Record: 12-2
Pythagorean Record: 12.9-1.1
PF: 379 (27.1/g) 1st of 1
PA: 133 (9.5/g) 1st of 16
Playoffs: Won Divisional 23-20 (Rams)
Won NFL Championship 27-7 (Browns)
Lost Super Bowl IV 7-23 (Chiefs)
NFC South
1998 Atlanta Falcons
Regular Season Record: 14-2
Pythagorean Record: 11.7-4.3
PF: 442 (27.6/g) 4th of 30
PA: 289 (18.1/g) 4th of 30
Playoffs: Won Divisional 20-18 (49ers)
Won NFC Conf. Championship 30-27 (Vikings)
Lost Super Bowl XXXIII (Broncos)
1996 Carolina Panthers
Regular Season Record: 12-4
Pythagorean Record: 12.4-3.6
PF: 367 (22.9/g) 7th of 30
PA: 218 (13.6/g) 2nd of 30
Playoffs: Won Divisional 26-17 (Cowboys)
Lost NFC Conf. Championship 13-30 (Packers)
1992 New Orleans Saints
Regular Season Record: 12-4
Pythagorean Record: 12.2-3.8
PF: 330 (20.6/g) 10th of 28
PA: 202 (12.6/g) 1st of 28
Playoffs: Lost Wild Card 20-36 (Eagles)
2002 Tampa Bay Buccaneers
Regular Season Record: 12-4
Pythagorean Record: 12.7-3.3
PF: 346 (21.6/g) 18th of 32
PA: 196 (12.3/g) 1st of 32
Playoffs: Won Divisional 31-6 (49ers)
Won NFC Conf. Championship 27-10 (Eagles)
Won Super Bowl 48-21 XXXVII (Raiders)
NFC West
2015 Arizona Cardinals
Regular Season Record: 13-3
Pythagorean Record: 11.9-4.1
PF: 489 (30.6/g) 2nd of 32
PA: 313 (19.6/g) 7th of 32
Playoffs: Won Divisional 26-20 (Packers)
Lost NFC Conf. Championship 19-49 (Panthers)
1975 Los Angeles Rams
Regular Season Record: 12-2
Pythagorean Record: 12.3-1.7
PF: 312 (22.3/g) 11th of 26
PA: 135 (9.6/g) 1st of 26
Playoffs: Won Divisional 35-23 (Cardinals)
Lost NFC Conf. Championship 7-37 (Cowboys)
1984 San Francisco 49ers
Regular Season Record: 15-1
Pythagorean Record: 13.6-2.4
PF: 475 (29.7/g) 2nd of 28
PA: 227 (14.2/g) 1st of 28
Playoffs: Won Divisional 21-10 (Giants)
Won NFC Conf. Championship 23-0 (Bears)
Won Super Bowl XIX 38-16 (Dolphins)
2013 Seattle Seahawks
Regular Season Record: 13-3
Pythagorean Record: 12.8-3.2
PF: 417 (26.1/g) 8th of 32
PA: 231 (14.4/g) 1st of 32
Playoffs: Won Divisional 23-15 (Saints)
Won NFC Conf. Championship 23-17 (49ers)
Won Super Bowl XLVIII 43-8 (Broncos)
§
3. Top Ten Regular Seasons Overall (Super Bowl Era)
While I could simply take the top ten teams from the previous mini-analysis, this leaves open the possibility of missing out a second or third-best regular season from a high-performing team. For example, perhaps the 49ers in their decade of dominance might find themselves on the list twice. As the Pythagorean Theorem provided wins and losses to the nearest tenth, it was possible that there were ties. Therefore, I set the following criteria for tiebreakers: 1. Head-to-head result; 2. Postseason success that season; 3. Which team I like better.
I do feel that at the top end, the Pythagorean Theorem overemphasizes defense, as (spoiler alert), all teams are from the 1960s to 1980s. Nevertheless, here are the Top Ten teams based off of the Pythagorean Theorem metric:
10. 1972 Miami Dolphins
Pythagorean Win Percentage: 0.871
Tiebreak: Criterion 2
Regular Season Record: 14-0
Pythagorean Record: 12.2-1.8
PF: 385 (27.5/g) 1st of 26
PA: 171 (12.2/g) 1st of 26
Playoffs: Won Divisional 20-14 (Browns)
Won AFC Conf. Championship 21-17 (Steelers)
Won Super Bowl VII 14-7 (Redskins)
9. 1968 Dallas Cowboys
Pythagorean Win Percentage: 0.871
Regular Season Record: 12-2
Pythagorean Record: 12.3-1.7
PF: 431 (30.8/g) 1st of 16
PA: 186 (13.3/g) 2nd of 16
Playoffs: Lost Divisional 20-31 (Browns)
8. 1975 Pittsburgh Steelers
Pythagorean Win Percentage: 0.871
Tiebreak: Criterion 2
Regular Season Record: 13-2
Pythagorean Record: 12.9-1.1
PF: 373 (26.6/g) 5th of 26
PA: 162 (11.6/g) 2nd of 26
Playoffs: Won Divisional 28-10 (Colts)
Won AFC Conf. Championship 16-10 (Raiders)
Won Super Bowl X 21-17 (Cowboys)
7. 1975 Los Angeles Rams
Pythagorean Win Percentage: 0.879
Tiebreak: Criterion 1
Regular Season Record: 12-2
Pythagorean Record: 12.3-1.7
PF: 312 (22.3/g) 11th of 26
PA: 135 (9.6/g) 1st of 26
Playoffs: Won Divisional 35-23 (Cardinals)
Lost NFC Conf. Championship 7-37 (Cowboys)
6. 1973 Miami Dolphins
Pythagorean Win Percentage: 0.879
Tiebreak: Criterion 2
Regular Season Record: 12-2
Pythagorean Record: 12.3-1.7
PF: 343 (24.5/g) 5th of 26
PA: 150 (10.7/g) 1st of 26
Playoffs: Won Divisional 34-16 (Bengals)
Won AFC Conf. Championship 27-10 (Raiders)
Won Super Bowl VIII 24-7 (Vikings)
5. 1985 Chicago Bears
Pythagorean Win Percentage: 0.881
Regular Season Record: 15-1
Pythagorean Record: 14.1-1.9
PF: 456 (28.5/g) 2nd of 28
PA: 198 (12.4/g) 1st of 28
Playoffs: Won Divisional 21-0 (Giants)
Won NFC Conf. Championship 24-0 (Rams)
Won Super Bowl XX 46-10 (Patriots)
4. 1970 Minnesota Vikings
Pythagorean Win Percentage: 0.886
Regular Season Record: 12-2
Pythagorean Record: 12.4-1.6
PF: 335 (23.9/g) 3rd of 26
PA: 143 (10.2/g) 1st of 26
Playoffs: Lost Divisional 14-17 (49ers)
3. 1976 Pittsburgh Steelers
Pythagorean Win Percentage: 0.893
Regular Season Record: 10-4
Pythagorean Record: 12.5-1.5
PF: 342 (24.4/g) 5th of 28
PA: 138 (9.9/g) 1st of 28
Playoffs: Won Divisional 40-14 (Colts)
Lost AFC Conf. Championship 7-24 (Raiders)
2. 1969 Minnesota Vikings
Pythagorean Win Percentage: 0.921
Regular Season Record: 12-2
Pythagorean Record: 12.9-1.1
PF: 379 (27.1/g) 1st of 16
PA: 133 (9.5/g) 1st of 16
Playoffs: Won Divisional 23-20 (Rams)
Won NFL Championship 27-7 (Browns)
Lost Super Bowl IV 7-23 (Chiefs)
1. 1968 Baltimore Colts (Indianapolis Colts)
Pythagorean Win Percentage: 0.921
Tiebreak: Criterion 3
Regular Season Record: 13-1
Pythagorean Record: 12.9-1.1
PF: 402 (28.7/g) 2nd of 16
PA: 144 (10.3/g) 1st of 16
Playoffs: Won Divisional 24-14 (Vikings)
Won NFL Championship 34-0 (Browns)
Lost Super Bowl III 7-16 (Jets)
A few takeaways from this top ten list. First, the majority of these teams did not win a championship (exceptions are 1972 and 1973 Miami Dolphins, 1975 Pittsburgh Steelers, and 1985 Chicago Bears). However, the teams that did not win were really, really good – and it is not surprising that two more of these franchises did win a Lombardi a few years later or earlier from the listed season (e.g., 1970 Baltimore Colts, 1971 Dallas Cowboys). Sorry, Purple Eaters and LA Rams… Second, all of these teams either ranked first or second in points allowed, which I think drove the expected win-loss a bit too high for many of these teams. Third, while the majority of these teams are not counted among the top to play by NFL fans, the aforementioned ones that won a Lombardi, especially the 1972 Dolphins and 1985 Bears, do find themselves frequently discussed as among the greatest teams to ever play. Fourth, I find it fitting that the 1968 Baltimore Colts have the best regular season based off this metric, as it only lends further weight to their upset in the 1969 Super Bowl matchup against Broadway Joe and the Jets.
Finally, how did my predictions pan out? I managed to only pick the tenth-ranked 1972 Miami Dolphins and the fifth-ranked 1985 Chicago Bears. Though as I mentioned before, there were 2,062 seasons of play, so it’s not that easy!
As for the other guesses:
1984 49ers (15-1) |#18 regular season overall, Pythagorean win percentage 0.850
1991 Redskins (14-2) |#T-15 regular season overall, Pythagorean win percentage 0.863
2007 Patriots (16-0) |#T-15 regular season overall, Pythagorean win percentage 0.863
And for good measure:
1996 Packers (13-3) |#T-15 regular season overall, Pythagorean win percentage 0.863
Reflection
Now, at the end of the day, you can look at this analysis as ludicrous, and you would be totally right. Paraphrasing Lombardi – what is the point of calculating expected regular season wins, if actual wins (and postseason performance) are what matter? However, it was a fun thing to write, and that is good enough for me.
Cheers, and Go Pack Go! 
