
Inspiration
The idea to analyze looking came to me as I was thinking of the upcoming road trip that my dad and I were going to make from Wisconsin to New York City. When travelling, or even thinking of traveling, I find myself to somehow acquire, for brief amounts of time, that spark of creativity and the energetic drive to carry out the wacky ideas that come to mind. Enjoy, and drive safely!
Are You a Looker?
What is life without pet peeves? Does it make me a bad person if I really like having them? You know, if I were to one day have a pet, I really well might name it Peeves. However, I don’t really hold it against someone if they exhibit one of my pet peeves, as the majority of mine are so silly and inconsequential that they might as well find themselves at home in a Seinfeld episode. Here are five pet peeves from the top of my head:
1. When someone exhibits selective tardiness, in that the individual promptly appears for required professional outings though arrives for social outings much later than fashionably late
2a. When someone finishes the last of the water from the Brita and does not refill the contents
2b. Ditto, with toilet paper
3. When someone jackhammers the elevator button with one’s finger
4a. When someone is a “looker,” defined as an individual sitting in a seat alongside you who attempts to read your fill-in-the-blank (e.g., book page, phone/tablet/computer screen)
4b. When someone is a “looker,” defined as a driver of a car who glances directly sideways at the car next to them in lieu of the road ahead of them
5. When someone overanalyzes the smallest things, like me when coming up with this idea and carrying it through to completion
§
It is to pet peeve 4b. that I endeavor to explore further in this mini-analysis. What I find so compelling about this peeve is that empirically I feel that this situation occurs with some not-insignificant frequency. Everyone does it at some time or another, I know that. I really try not to myself, though once-and-a-half times in a blue moon I slip up, I admit. You may notice that I categorize “looking” as a mere pet peeve and not as a peccadillo and certainly not as a minor sin, the latter two categorizations with which I associate with the related terms “gawking” and “rubbernecking,” respectively. Certainly, looking is much more harmless compared to something like texting while driving or driving under the influence.
Nevertheless, I decided to carry out an informal, non-scientific, heavily-biased ‘experiment’ to guesstimate the relative frequency of “looking” on American highways. Here’s what I came up with.
§
For the past decade or so, I have been mostly spending my time in undergraduate or graduate studies on the East Coast, though I was able to have four months’ time back home with family at the beginning of the year. Our family greatly prefers a long road trip over a flight, and my parents must have made the trip from the Midwest to the East Coast at least twenty times, no joke. We always make it a one-day affair. This time, it was just my dad and I on the way there, and my dad himself on the drive back.
The drive, according to Google Maps, covers 14 hours driving time across 900 miles and the following states: Wisconsin, Illinois, Indiana, Ohio, Pennsylvania, New Jersey, and New York. Per tradition, my dad started the drive off, but then I took on the middle portion before he reclaimed the wheel for the final couple of hours on the road.
I only included vehicles alongside the right of our car. Although it is of course possible to be a two-way looker, it is considerably more difficult for me to record data for vehicles from both sides. Therefore, I restricted analysis to left-lookers only. For each vehicle, I would record the following: 1. Looking; 2. Overtake (i.e., whether we passed the vehicle or were passed ourselves); 3. Gender of driver; 4. Type of vehicle (divided into sedan, van, sports utility vehicle, pickup, or truck); 5. Color of vehicle; 6. State of license plate.
With trucks specifically, I modified a few variables: for variable 5, I recorded the color of the cab, not the semi-trailer, though often the two matched; for variable 6, I did not record state of license plate, as it was somewhat difficult to make out in many cases. Also, given the elevated vantage point of the truck driver, it seemed to me that the lane over and two lanes over were well within the potential range of a looker, so I recorded looker details for trucks up to two lanes on the right of our car.
§
In summary, I recorded looker details of 187 vehicles across nine unique state license plates (not counting various truck licenses). I recorded the data first on notepad paper before transitioning to an Excel spreadsheet after I got back to my apartment in New York. I should note that my dad drove the first four hours and last two hours of the trip while I drove the middle seven-and-a-half or so; this meant that he drove the entirety of the Wisconsin, Illinois, Indiana, New Jersey, and New York segments while I drove the entirety of the Ohio and most of the Pennsylvania segments. I suppose we tend to drive a few clicks northward of the designated speed limit such that the time elapsed was about half-an-hour lower than that stated in Google Maps.
Below are a few summary data tables:
Table 1: Frequency of overtakes, lookers, and male drivers (n = 187)
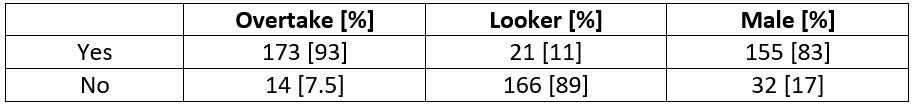
Table 2: Frequency of vehicle types and lookers (n = 187)
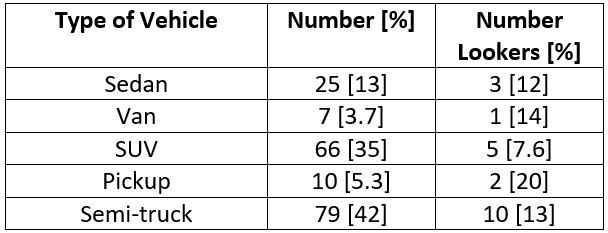
Table 3: Frequency of state license plates (n = 108)
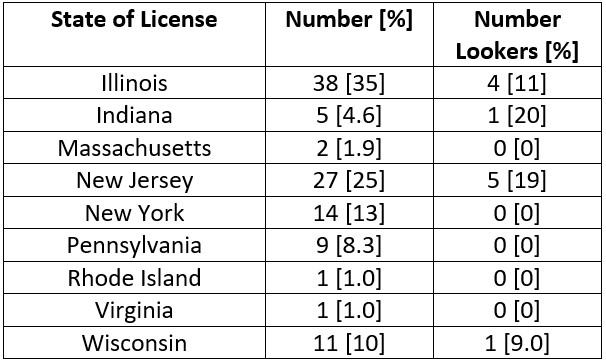
From Table 1, we see that the majority (93%) of vehicles encountered were overtaken by our car, which makes sense as I only recorded vehicles coming from our right, generally corresponding to slower traffic. The majority (83%) of drivers were male, and there was a total of 21 lookers, or 11% that of the total drivers encountered. As seen in Table 2, a plurality of vehicles were of type semi-truck (42%), followed closely by SUVs (35%) and sedans (13%), with a remainder comprised of vans and pickup trucks. The state licenses corresponding to the highest number of vehicles were from Illinois (n = 38), New Jersey (n = 27), and New York (n = 14). Keep in mind that I drove pretty much the entire segment covering Ohio and Pennsylvania, accounting for the limited representation from these two states. Also, I decide to stop recording at sunset (19:32), given that the diminished visibility which would likely dissuade drivers from looking in lieu of keeping their eyes on the road.
In terms of gender, males accounted for 20 of the 21 looks, at a rate of 13%, compared with females at a rate of 3%. Perhaps this sounds significant – I’d rather not perform any formal statistical analysis in this write-up – but given the low numbers of lookers overall, I doubt it has any power to uncover a difference. From a vehicle standpoint, pickups had the highest rate of lookers at 20%, followed by vans (14%), trucks (13%), sedans (12%) and SUVs (7.5%).
I should also mention, before I forget, that the weather from Ohio onwards was quite poor, in that there was a significant drizzle throughout. I am inclined to believe that this would lower the rate of would-be lookers. Subdividing the data by pre-rain and post-rain, we get a sample size of n = 119 and n = 68, respectively. In terms of lookers, the data indicates 14 (12%) before and 7 (10%) after – a small decline, but nothing very significant.
I had the offhand theory that the rate of looking would be inversely proportional to the visual sensory stimulus experienced by the driver; that is, if the driver finds themselves on a flat, featureless, dull road, they would be more apt to look over in hopes of seeing something (or someone) of interest. However, defining how featureless a state is is but a wholly subjective endeavor and merit little substantive results… though Pennsylvania is beautiful to drive through!
If there is a takeaway at all from this little experiment, it is that I have wasted too much time on it! Before I conclude this document, I should mention that before the road trip I had discussed this idea for a writing piece with a friend, who posited the notion that rates of looking perhaps will be elevated due to my looking at the drivers – this begs another thought experiment – how strong is the sense that one is being watched?
Reflection
Yeah, I have a lot of pet peeves… however, who doesn’t? I do wish I was able to capture a sample during the route crossing Ohio and Pennsylvania, but I do not think it would really have affected the results. My dad got a humored smile during the road trip when I told him why I was scribbling on the notepad every time a vehicle came along.